


Data interpretation graph (or) bar chart is the simplest way of representing statistical data either vertically or horizontally using bar different heights having two parameters of these two parameters. One parameter is plotted on the horizontal axis and other on the vertical axis.
Some important points are considered while drawing bar graph are as follows:
- The bar graph is a group of rectangular bars generally of uniform width and is drawn equidistance from each other.
- As the height of rectangular bars are proportional to the values which they represent the scale is selected keeping in mind the magnitude of greatest value.
- All the bars are drawn on the same baseline only.
- These bars may be constructed horizontally (or) vertically.
- Generally, vertical bars are arranged from left to right.
- And horizontal bars are arranged from top to bottom.
- For vertical bar graphs to get the idea of bar graph title is represented at the top.
- For horizontal bar graphs title is represented on the right side.
- A brief note is also given at the right side bottom (or) top with a clear explanation of various types of shades color and designed used while drawing bar graph (or) bar chart.
- A footer note with exceptional conditions is also represented at the bottom of the bar graph diagram.
Types of bar graphs in data interpretation
Bar graphs are categorized into four different types. They are:
- Simple bar graph
- Multiple bar graph
- Sub-multiple bar graph
- Percentage bar graph
Data interpretation bar graph examples and solutions below bar diagram show the production of cars in each year by a company.
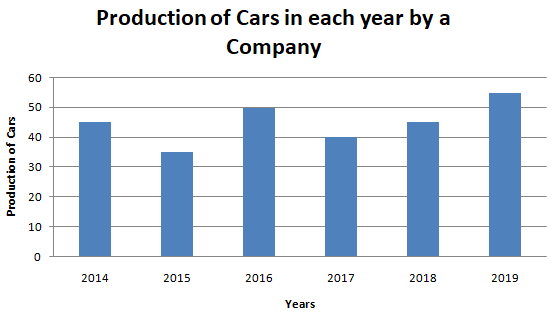
- What is the average production of cars?
average production of cars = (45+35+50+40+45+55)/6
= 270/6.
- The percentage drop in cars production between 2016 and 2017 is
sol:
production of cars in 2016=50
production of cars in 2017=40
drop in production of cars= 50-40=10
required percentage drop is
=(10/50)×100=20%
Read More
| Data Interpretation Basics | Data Interpretation Table |
| Data Interpretation Pie Chart | Data Interpretation Line Graph |


