


Data interpretation of the pie chart is the representation of data in a circle that is divided into various sectors. These sectors are constructed in such a way that the area of each sector is proportional to the corresponding magnitude of the data represented by the sector.
Some useful points in data interpretation of pie chart:
- Here, different sectors in a pie chart are considered as component parts.
- In a pie chart component parts are expressed in 3 types.
- Either component values in percentages.
- The fractional ratio of respective total value given.
- Sector angle of respective total value given
- Since the pie chart is a circle and it has 360 degrees at its center which are equal to 100% of component values when added.
- 100% of component values represented on the pie chart are equal to 360 degrees angle of the pie chart.
100%=360 degrees
1%=3.6 degrees
So, when the percentage of component values is given they can be converted to a degree by multiplying each of the percentage values with 3.6 degrees.
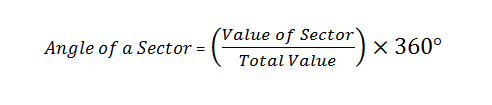
The formula for the angle of a sector:
But when component/sector value is not given in percentage then component/sector values can be represented by using the below the angle of sector formula.
Example problem:
Below pie chart shows the percentage of the number of students enrolled in a school / in different activities.

To convert the pie chart into degrees we need to do the following conversions:
| Total | Percentage | Degree |
| Red cross | 10 | 36 |
| NCC | 5 | 18 |
| Human resource development club | 10 | 36 |
| Debating club | 25 | 90 |
| Eco club | 20 | 72 |
| Scout | 30 | 108 |
Formula to find the percentage of a sector when the angle of the sector is given

Example problem:
Let us consider the Red Cross-sector from the above example
Percentage of Red Cross Sector=10
Total value is (Total Angle)=360 degrees
Therefore, the angle of the Red Cross sector=(10/100) ×360=36 degrees
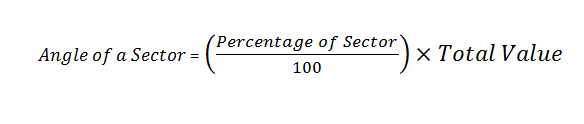
Formulas to find the angle of a sector when the percentage of the sector is given
Example problem:
For this Red Cross-sector only let us consider the resultant angle 36 degrees and find percentage.
Here,
The angle of Red Cross sector=360 degrees
Total value is (Total percentage value)=100%
Percentage of Red Cross sector=(36/360) × 100=10%
Data interpretation pie chart example question with the solution:
Study the following pie chart given here which represents a domestic expenditure of family in percentage and answer the following questions. Total months income of the family is 55,750 rupees
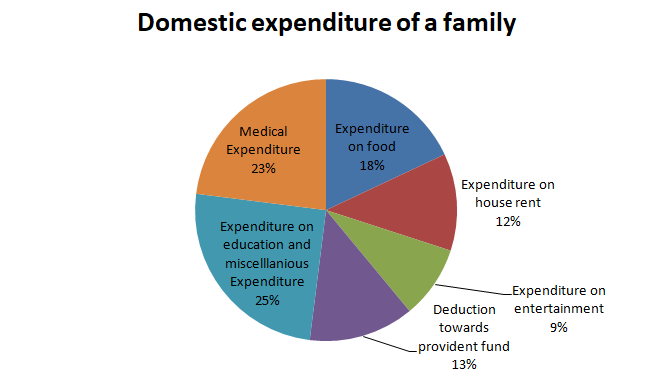
- House rent per month is
12/100 × 55,750
- The annual savings in the form of provident fund is
(13/100) × (55750 ×12)
Annual PF savings=13% of (55750 ×12)
- The total amount per month, the family spends on food & entertainment combined together is
(18%+9%) ×55750
⇒ 27/100 ×55750
Read More
| Data Interpretation Basics | Data Interpretation Table |
| Data Interpretation Bar Graph | Data Interpretation Line Graph |


