


The data interpretation table is the simplest method adopted for summarizing and interpreting data in a meaningful way. Here in table charts data is arranged systematically in the form of rows and columns. This helps in easy comparison of facts and makes conclusions quickly. Now, let’s understand various parts considered in representing a table chart. These various parts are like the title of the table, columns and row headings, headnote and footnote.
Terms involved in Data Interpretation Table Chart
Title:
Generally, a small description of the information present in the table is given a title.
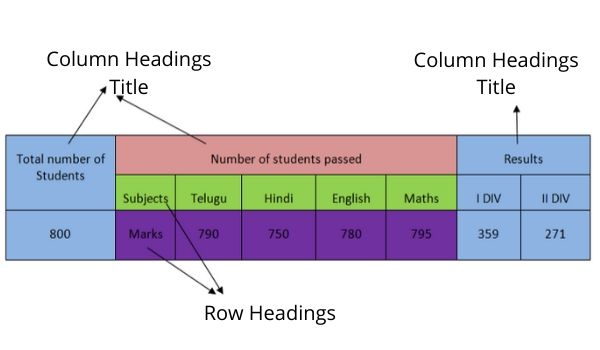
Column headings:
These headings generally represent the headings for data present in such columns. (units of data can also be represented here)
Row headings:
Here these represent heading for whole data present in such rows. (Units of data can also be representing here itself).
Headnote:
Here a small description to table with specific terms (like units) wise represented.
Footer note:
For representing additional data or any exceptional conditions, a footer note is used. This can be clearly understood by an example problem.
Data Interpretation Table Example
Head Note:
The below table gives information about the total number of students present in a class and also how many students have been passed with their distinctions. Observe the data and answer the questions asked below.
Footer note: No student is failed in more than two subjects.
How many students are failed in two subjects?
Solution:
I div + ii div =359+271=630
Total no. of students = 800
Total no. of students failed = total no. of students-(I div + II div)
= 800-630
= 170
No. of students failed in Telugu =10
No. of students failed in Hindi=50
No. of students failed in English=20
No. of students failed in Maths=5
Total no. of students failed in subject wise =10+50+20+5=85
Therefore, the total number of students failed in two subjects = 170-85=85.
Read More
| Data Interpretation Basics | Data Interpretation Pie Chart |
| Data Interpretation Bar Graph | Data Interpretation Line Graph |


